# 一、初识Graphviz
# 1.1 简介
GraphViz是一个开源的图像可视化的软件,是贝尔实验室开发的一个开源的工具包,它使用一个特定的DSL(领域特定语言):dot作为脚本语言,然后使用布局引擎来解析此脚本,并完成自动布局。graphviz提供丰富的导出格式,如常用的图片格式,SVG,
# 1.2 环境搭建
结合sublime Text插件实时编译预览
使用
shift+command+p,输入搜索选中Package Control: Install Package,然后输入GraphViz,然后安装GraphVizPreview即可,安装完成后,只要全选中代码,然后按shift+command+g就可以预览了。
- 其实也可以直接用
brew安装GraphViz,但是每次要敲命令行,太麻烦了
mac下执行
brew install graphviz
终端编译代码
dot test.dot -T png -o test.png
# 二、使用
Graphviz支持两类图:无向图(graph,用“- -”表示节点之间)和 有向图(digraph,用“->” 表示节点之间)。graphviz包含3中元素,图,顶点和边。每个元素都可以具有各自的属性,用来定义字体,样式,颜色,形状等
GraphViz中包含多种布局
dot默认布局,用于有向图neato基于spring-model算法(force-based)twopo径向布局circo圆形布局fdp用于无向图
# 2.1 第一个graphviz图
语法介绍 http://graphs.grevian.org/reference
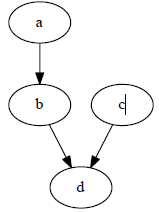
digraph abc{
  a;
  b;
  c;
  d;

  a -> b;
  b -> d;
  c -> d;
}
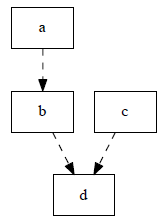
定义顶点和边的样式
digraph abc{
  node [shape="record"];
  edge [style="dashed"];
  a;
  b;
  c;
  d;

  a -> b;
  b -> d;
  c -> d;
}
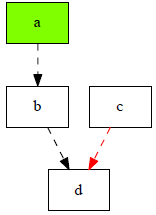
进一步修改顶点和边样式,将顶点
a的颜色改为淡绿色,并将c到d的边改为红色
digraph abc{
  node [shape="record"];
  edge [style="dashed"];

  a [style="filled", color="black", fillcolor="chartreuse"];
  b;
  c;
  d;

  a -> b;
  b -> d;
  c -> d [color="red"];
}
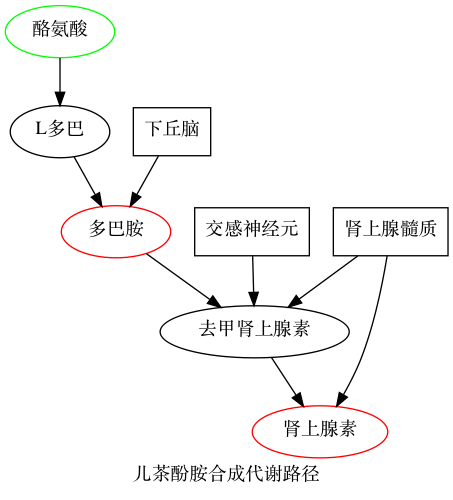
其他例子
digraph demo{
  label="儿茶酚胺合成代谢路径";

  酪氨酸 -> L多巴 -> 多巴胺 -> 去甲肾上腺素 -> 肾上腺素;

  下丘脑 -> 多巴胺;
  交感神经元 -> 去甲肾上腺素;
  肾上腺髓质 -> 去甲肾上腺素,肾上腺素;

  酪氨酸 [label="酪氨酸",color=green];
  多巴胺 [label="多巴胺", color=red];
  肾上腺素 [label="肾上腺素", color=red];

  下丘脑 [shape=box];
  交感神经元 [shape=box];
  肾上腺髓质 [shape=box];
}
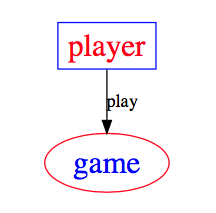
# 2.2 带标签
digraph {

    player[label = "player", color = Blue, fontcolor = Red, fontsize = 24, shape = box];
    game[label = "game", color = Red, fontcolor = Blue, fontsize = 24, shape = ellipse];

    player -> game[label = "play"]
}
# 2.3 子视图
digraph {

    label = visitNet

    rankdir = LR

    node[color = Red, fontsize = 24, shape = box]
    edge[color = Blue, style = "dashed"]

    user[style = "filled", color = "yellow", fillcolor = "chartreuse"]
    subgraph cluster_cd{
        label = "server and browser"
        bgcolor = green;

        browser -> server
    }

    user -> computer;
    computer -> browser;
}

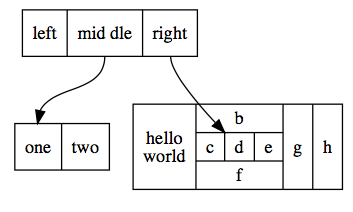
# 2.4 结构视图
digraph {
node[shape = record];
struct1[label = "<f0> left|<f1> mid\ dle|<f2> right"];
struct2[label = "<f0> one|<f1> two"];
struct3[label = "hello\nworld | {b|{c|<here> d|e}|f}|g|h"];
struct1:f1 -> struct2:f0;
struct1:f2 -> struct3:here;
}
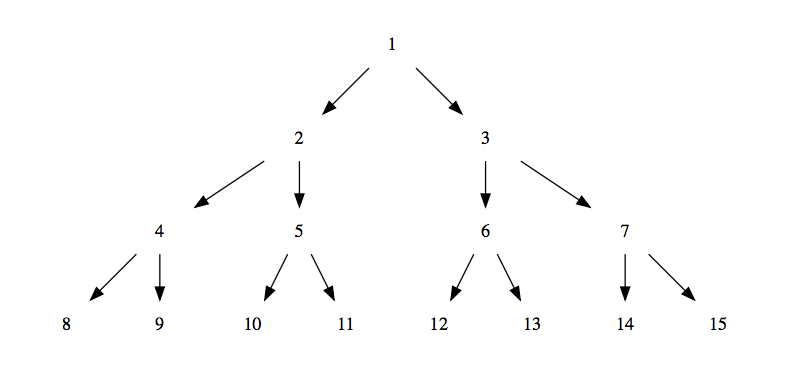
# 2.5 树形结构
digraph tree {

  fontname = "PingFang-SC-Light"
  fontsize = 24

  node[shape = "plaintext"]

  1 -> 2;
  1 -> 3;
  2 -> 4;
  2 -> 5;
  3 -> 6;
  3 -> 7;
  4 -> 8;
  4 -> 9;
  5 -> 10;
  5 -> 11;
  6 -> 12;
  6 -> 13;
  7 -> 14;
  7 -> 15;
}
# 2.6 时序图
digraph time {

    rankdir = "LR";
    node[shape = "point", width = 0, height = 0];
    edge[arrowhead = "none", style = "dashed"];

    {
        rank = "same"
        edge[style = "solided"];
        APP[shape = "plaintext"];
        APP -> step00 -> step01 -> step02 -> step03 -> step04 -> step05;
    }

    {
        rank="same";
        edge[style="solided"];
        SDK[shape="plaintext"];
        SDK -> step10 -> step11 -> step12 -> step13 -> step14 -> step15;
    }
    {
        rank="same";
        edge[style="solided"];
        AliPay[shape="plaintext"];
        AliPay -> step20 -> step21 -> step22 -> step23 -> step24 -> step25;
    }
    {
        rank="same";
        edge[style="solided"];
        Server[shape="plaintext"];
        Server -> step30 -> step31 -> step32 -> step33 -> step34 -> step35;
    }

    step00 -> step10 [label="sends order info", arrowhead="normal"];
    step11 -> step21 [label="open AliPay", arrowhead="normal"];
    step22 -> step12 [label="pay success", arrowhead="normal"];
    step13 -> step03 [label="pay success", arrowhead="normal"];
    step24 -> step34 [label="pay success", arrowhead="normal"];
}
# 2.7 一个hash表的数据结构
hash表内容
struct st_hash_type {
    int (*compare) ();
    int (*hash) ();
};

struct st_table_entry {
    unsigned int hash;
    char *key;
    char *record;
    st_table_entry *next;
};

struct st_table {
    struct st_hash_type *type;
    int num_bins;
/* slot count */
    int num_entries;
/* total number of entries */
    struct st_table_entry **bins;
/* slot */
};
脚本如下:
digraph st2{
  fontname = "Verdana";
  fontsize = 10;
  rankdir=TB;

  node [fontname = "Verdana", fontsize = 10, color="skyblue", shape="record"];

  edge [fontname = "Verdana", fontsize = 10, color="crimson", style="solid"];

  st_hash_type [label="{<head>st_hash_type|(*compare)|(*hash)}"];
  st_table_entry [label="{<head>st_table_entry|hash|key|record|<next>next}"];
  st_table [label="{st_table|<type>type|num_bins|num_entries|<bins>bins}"];

  st_table:bins -> st_table_entry:head;
  st_table:type -> st_hash_type:head;
  st_table_entry:next -> st_table_entry:head [style="dashed", color="forestgreen"];
}

# 2.8 模块的生命周期图
digraph module_lc{
  rankdir=TB;
  fontname = "Microsoft YaHei";
  fontsize = 12;

  node [fontname = "Microsoft YaHei", fontsize = 12, shape = "Mrecord", color="skyblue", style="filled"];
  edge [fontname = "Microsoft YaHei", fontsize = 12, color="darkgreen" ];

  installed [label="已安装状态"];
  resolved [label="已就绪状态"];
  uninstalled [label="已卸载状态"];
  starting [label="正在启动"];
  active [label="已激活(运行)状态"];
  stopping [label="正在停止"];
  start [label="", shape="circle", width=0.5, fixedsize=true, style="filled", color="black"];

  start -> installed [label="安装"];
  installed -> uninstalled [label="卸载"];
  installed -> resolved [label="准备"];
  installed -> installed [label="更新"];
  resolved -> installed [label="更新"];
  resolved -> uninstalled [label="卸载"];
  resolved -> starting [label="启动"];
  starting -> active [label=""];
  active -> stopping [label="停止"];
  stopping -> resolved [label=""];
}

# 2.9 简单的UML类图
digraph G{

  fontname = "Courier New"
  fontsize = 10

  node [ fontname = "Courier New", fontsize = 10, shape = "record" ];
  edge [ fontname = "Courier New", fontsize = 10 ];

  Animal [ label = "{Animal |+ name : String\\l+ age : int\\l|+ die() : void\\l}" ];

      subgraph clusterAnimalImpl{
          bgcolor="yellow"
          Dog [ label = "{Dog||+ bark() : void\\l}" ];
          Cat [ label = "{Cat||+ meow() : void\\l}" ];
      };

  edge [ arrowhead = "empty" ];

  Dog->Animal;
  Cat->Animal;
  Dog->Cat [arrowhead="none", label="0..*"];
}

# 2.10 有限状态机
digraph finite_state_machine {
    rankdir=LR;
    size="8,5"
    node [shape = circle];
    S0 -> S1 [ label = "Lift Nozzle" ]
    S1 -> S0 [ label = "Replace Nozzle" ]
    S1 -> S2 [ label = "Authorize Pump" ]
    S2 -> S0 [ label = "Replace Nozzle" ]
    S2 -> S3 [ label = "Pull Trigger" ]
    S3 -> S2 [ label = "Release Trigger" ]
}

# 三、语法
完整列表 http://graphviz.org/doc/info/attrs.html
# 3.1 图像属性
label="My Graph";给图像设置标签rankdir=LR; 将图片由原来的从上到下布局变成从左到右布局{rank=same; a, b, c }将一组元素放到同一个levelsplines="line"; 让边框变为直线,没有曲线和锐角K=0.6; 用来在布局中影响spring属性,spring属性可以用于将节点往外推,这个在twopi和sfdp布局中很有用。
# 3.2 交点属性
[label="Some Label"]给交点打标签[color="red"]给交点上色[fillcolor="blue"]设置交点的填充色
# 3.3 边的属性
[label="Some Label"]给边设置标签 (设置路径权重的时候很有用)[color="red"]# 给交点上色 (标示路径的时候很有用)[penwidth=2.0]# 给边适配厚度,标示路径的时候很有用。
# 3.4 尺寸, 背景颜色
fixedsize=true;size="1,1";resolution=72;bgcolor="#C6CFD532";
# 四、一些技巧
# 4.1 插入图片
digraph {

    c[shape = none, image = "./pic.png"]
    a -> b -> c;
    c -> d;
}
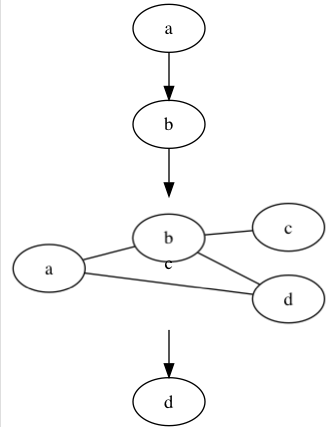
注:需要用命令行
dot test.dot -T png -o test.png生成,前提是用brew安装了GraphViz
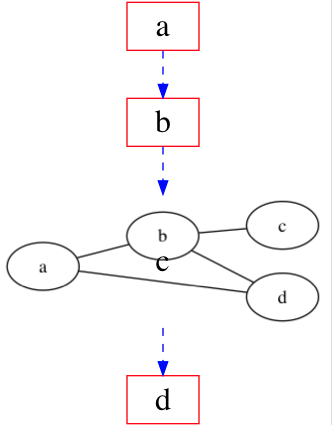
# 4.2 统一节点和连线
digraph {

    node[color = Red, fontsize = 24, shape = box]
    edge[color = Blue, style = "dashed"]

    c[shape = none, image = "./pic.png"]
    a -> b -> c;
    c -> d;
}
阅读全文
← 前端登录方案 实现一个360度全景插件 →


